Market Outlook
March 15, 2017
Market Cues
Domestic Indices
Chg (%)
(Pts)
(Close)
Indian markets are likely to open with a positive bias tracking the SGX Nifty.
BSE Sensex
1.7
496
29,443
US stocks fell as investors reduced positions ahead of the interest rate decision by
Nifty
1.7
152
9,087
the Federal Reserve. Analysts expect the Federal Reserve to hike interest rates but
Mid Cap
1.4
192
13,557
remain uncertain over the outlook for further tightening of interest rates. The energy
Small Cap
1.2
163
13,767
sector remained weak as crude oil prices continued to slip lower.
Bankex
1.9
457
24,083
UK stocks closed slightly negative in spite of an upward revision in Q4CY16 GDP
data as uncertainty remains over the upcoming Dutch parliamentary elections. GDP
Global Indices
Chg (%)
(Pts)
(Close)
was forecast to expand 1.4 percent instead of 1.1 percent in CY17. However, the
projection for 2018 was reduced to 1.3 percent from 1.4 percent.
Dow Jones
(0.2)
(44)
20,837
Nasdaq
(0.3)
(19)
5,857
Indian markets closed at an all-time high on Monday as markets cheered the
FTSE
(0.1)
(9)
7,358
election results. Most stock indices closed in positive territory with the Infra index
Nikkei
(0.1)
(24)
19,610
being the biggest gainer. The Nifty Infra index closed up
2.09 percent on
expectations of future government spending on infrastructure.
Hang Seng
(0.0)
(2)
23,828
Shanghai Com
0.1
2
3,239
News Analysis
USFDA to lift Import Alert on products from SunPharma Mohali Plant
Advances / Declines
BSE
NSE
Detailed analysis on Pg2
Advances
1,705
1,047
Investor’s Ready Reckoner
Declines
1,172
616
Unchanged
189
92
Key Domestic & Global Indicators
Stock Watch: Latest investment recommendations on 150+ stocks
Volumes (` Cr)
Refer Pg5 onwards
BSE
4,678
Top Picks
NSE
27,735
CMP
Target
Upside
Company
Sector
Rating
(`)
(`)
(%)
Amara Raja Batteries Auto & Auto Ancillary
Buy
832
1,009
21.3
Net Inflows (` Cr)
Net
Mtd
Ytd
HCL Tech
IT
Buy
853
1,000
17.3
FII
344
8,938
19,377
Power Grid Corp.
Power
Buy
194
223
15.2
MFs
(848)
(1,189)
5,881
Navkar Corp.
Others
Buy
171
265
55.3
KEI Industries
Others
Buy
175
207
18.0
Top Gainers
Price (`)
Chg (%)
More Top Picks on Pg3
Jubilant
822
9.8
Key Upcoming Events
Bajajelec
315
6.7
Previous
Consensus
Date
Region
Event Description
Reading
Expectations
Ceatltd
1,223
6.1
Mar 15 India
Exports YoY%
4.30
--
Icicibank
287
6.0
Mar 15 India
Imports YoY%
10.70
--
Srtransfin
1,014
5.9
Mar 15 US
Jobless claims change
(42.40)
--
Mar 15 India
Initial Jobless claims
243.00
240.00
Top Losers
Price (`)
Chg (%)
Mar 15 UK
Consumer price index (mom)
0.60
0.00
Jpassociat
14
(5.7)
Mar 16 US
FOMC rate decision
0.75
1.00
Centralbk
94
(3.9)
Mar 16 US
Euro-Zone CPI (YoY)
2.00
2.00
More Events on Pg4
Bharatfin
813
(1.9)
Fsl
42
(1.6)
Aplltd
614
(1.6)
As on March 14, 2017
Market Outlook
March 15, 2017
News Analysis
USFDA to lift Import Alert on products from SunPharma Mohali
Plant
Sun Pharmaceutical was informed by the US FDA, that it will lift the Import Alert
imposed on the Mohali (Punjab) manufacturing facility and remove the facility
from the Official Action Initiated (OAI) status. This proposed action will clear the
path for Sun Pharmaceutical to supply approved products from the Mohali facility
to the US market, subject to normal US FDA regulatory requirements.
The Mohali facility was inherited by Sun Pharmaceutical as part of its acquisition of
Ranbaxy Laboratories Ltd. in 2015. The US FDA had taken action against the
Mohali facility in 2013 when it ordered the facility to be fully subject to Ranbaxy’s
Consent Decree of Permanent Injunction. Certain conditions of the consent decree
will continue to be applicable to the Mohali facility. This will pave way for better
growth for the company in US and improvement in asset utilisations and hence
return ratios in long run. We maintain our buy with a price target of `847.
Economic and Political News
222 mineral blocks potentially on auction between 2017-18
CPI inflation increases to 3.65% for month of February 2017 from 3.17% in
January
Cabinet to consider doubling the ceiling of tax-free gratuity to `20 lakh
Banks expecting higher defaults in agricultural loans for FY17, rural credit
growth likely to slow down
Corporate News
TVS launches BS-IV compliant version of Jupiter scooter
SpiceJet to enter into retail sector with wholly owned stores
Jindal Stainless might complete de-merger by month end
CPCB orders Tata Chemicals to shut down its plant in Haldia
Market Outlook
March 15, 2017
Top Picks
Large Cap
Market Cap
CMP
Target
Upside
Company
Rationale
(` Cr)
(`)
(`)
(%)
To outpace battery industry growth due to better technological
Amara Raja Batteries
14,214
832
1,009
21.3
products leading to market share gains in both the
automotive OEM and replacement segments.
Strong growth in domestic business due to its leadership in
Alkem Laboratories
23,082
1,931
2,257
16.9
acute therapeutic segment. Alkem expects to launch more
products in USA, which bodes for its international business.
The stock is trading at attractive valuations and is factoring all
HCL Tech
1,20,356
853
1,000
17.3
the bad news.
Back on the growth trend, expect a long term growth of 14%
Infosys
2,37,734
1,035
1,249
20.6
to be a US$20bn in FY2020.
One of the largest pharma companies with strong
Lupin
65,522
1,451
1,809
24.7
international presence. It has a rich pipeline of ANDAs which
is also one of the largest among the generic companies.
Going forward, we expect the company to report strong top-
Power Grid Corporation
1,01,310
194
223
15.2
line CAGR of ~16% and bottom-line CAGR of ~19% over
FY16-18 on back of strong capitalization guidance
Source: Company, AngelResearch
Mid Cap
Market Cap
CMP
Target
Upside
Company
Rationale
(` Cr)
(`)
(`)
(%)
We expect the company would report strong profitability
Asian Granito
907
301
351
16.5
owing to better product mix, higher B2C sales and
amalgamation synergy.
Favourable outlook for the AC industry to augur well for
Cooling products business which is out pacing the market
Blue Star
5,252
550
634
15.4
growth. EMPPAC division's profitability to improve once
operating environment turns around.
Strong loan growth backed by diversified loan portfolio and
Equitas Holdings
5,551
164
235
42.9
adequate CAR. ROE & ROA likely to remain decent as risk of
dilution remains low. Attractive valuations considering growth.
Economic recovery to have favourable impact on advertising
& circulation revenue growth. Further, the acquisition of a
Jagran Prakashan
6,072
186
225
21.1
radio business (Radio City) would also boost the company's
revenue growth.
High order book execution in EPC segment, rising B2C sales
KEI Industries
1,365
175
207
18.0
and higher exports to boost the revenues and profitability
Speedier execution and speedier sales, strong revenue visibilty
Mahindra Lifespace
1,551
378
522
38.2
in short-to-long run, attractive valuations
Higher growth in domestic branded sales and healthy export
Mirza International
1,089
91
107
18.2
to boost the profitability.
Massive capacity expansion along with rail advantage at ICD
Navkar Corporation
2,433
171
265
55.3
as well CFS augurs well for the company
Market leadership in Hindi news genre and no. 2 viewership
ranking in English news genre, exit from the radio business,
TV Today Network
1,541
258
344
33.2
and anticipated growth in ad spends by corporates to benefit
the stock.
Source: Company, Angel Research
Market Outlook
March 15, 2017
Key Upcoming Events
Global economic events release calendar
Bloomberg Data
Date
Time
Country
Event Description
Unit
Period
Last Reported
Estimated
India
Exports YoY%
% Change
Feb
4.30
Mar 15, 2017
India
Imports YoY%
% Change
Feb
10.70
3:00 PM UK
Jobless claims change
% Change
Feb
-42.40
6:00 PM US
Initial Jobless claims
Thousands
Mar 11
243.00
240.00
6:00 PM US
Consumer price index (mom)
% Change
Feb
0.60
0.00
Mar 16, 2017
11:30 PM US
FOMC rate decision
%
Mar 15
0.75
1.00
3:30 PM Euro Zone Euro-Zone CPI (YoY)
%
Feb F
2.00
2.00
6:00 PM US
Housing Starts
Thousands
Feb
1246.00
1264.00
6:00 PM US
Building permits
Thousands
Feb
1293.00
1267.00
5:30 PM UK
BOE Announces rates
% Ratio
Mar 16
0.25
0.25
Mar 17, 2017
6:45 PM US
Industrial Production
%
Feb
-0.25
0.20
Mar 21, 2017
3:00 PM UK
CPI (YoY)
% Change
Feb
1.80
Mar 22, 2017
7:30 PM US
Existing home sales
Million
Feb
5.69
5.58
Mar 23, 2017
8:30 PM Euro Zone Euro-Zone Consumer Confidence
Value
Mar A
-6.20
7:30 PM US
New home sales
Thousands
Feb
555.00
560.00
Mar 24, 2017
2:00 PM Germany PMI Manufacturing
Value
Mar P
56.80
2:00 PM Germany PMI Services
Value
Mar P
54.40
Mar 28, 2017
7:30 PM US
Consumer Confidence
S.A./ 1985=100 Mar
114.80
112.00
Mar 30, 2017
6:00 PM US
GDP Qoq (Annualised)
% Change
4Q T
1.90
2.00
Mar 31, 2017
1:25 PM Germany Unemployment change (000's)
Thousands
Mar
(14.00)
6:30 AM China
PMI Manufacturing
Value
Mar
51.60
51.20
2:00 PM UK
GDP (YoY)
% Change
4Q F
2.00
Apr 03, 2017
2:00 PM UK
PMI Manufacturing
Value
Mar
54.60
Apr 06, 2017
2:30 PM India
RBI Reverse Repo rate
%
Apr 6
5.75
2:30 PM India
RBI Repo rate
%
Apr 6
6.25
Source: Bloomberg, Angel Research
Market Outlook
March 15, 2017
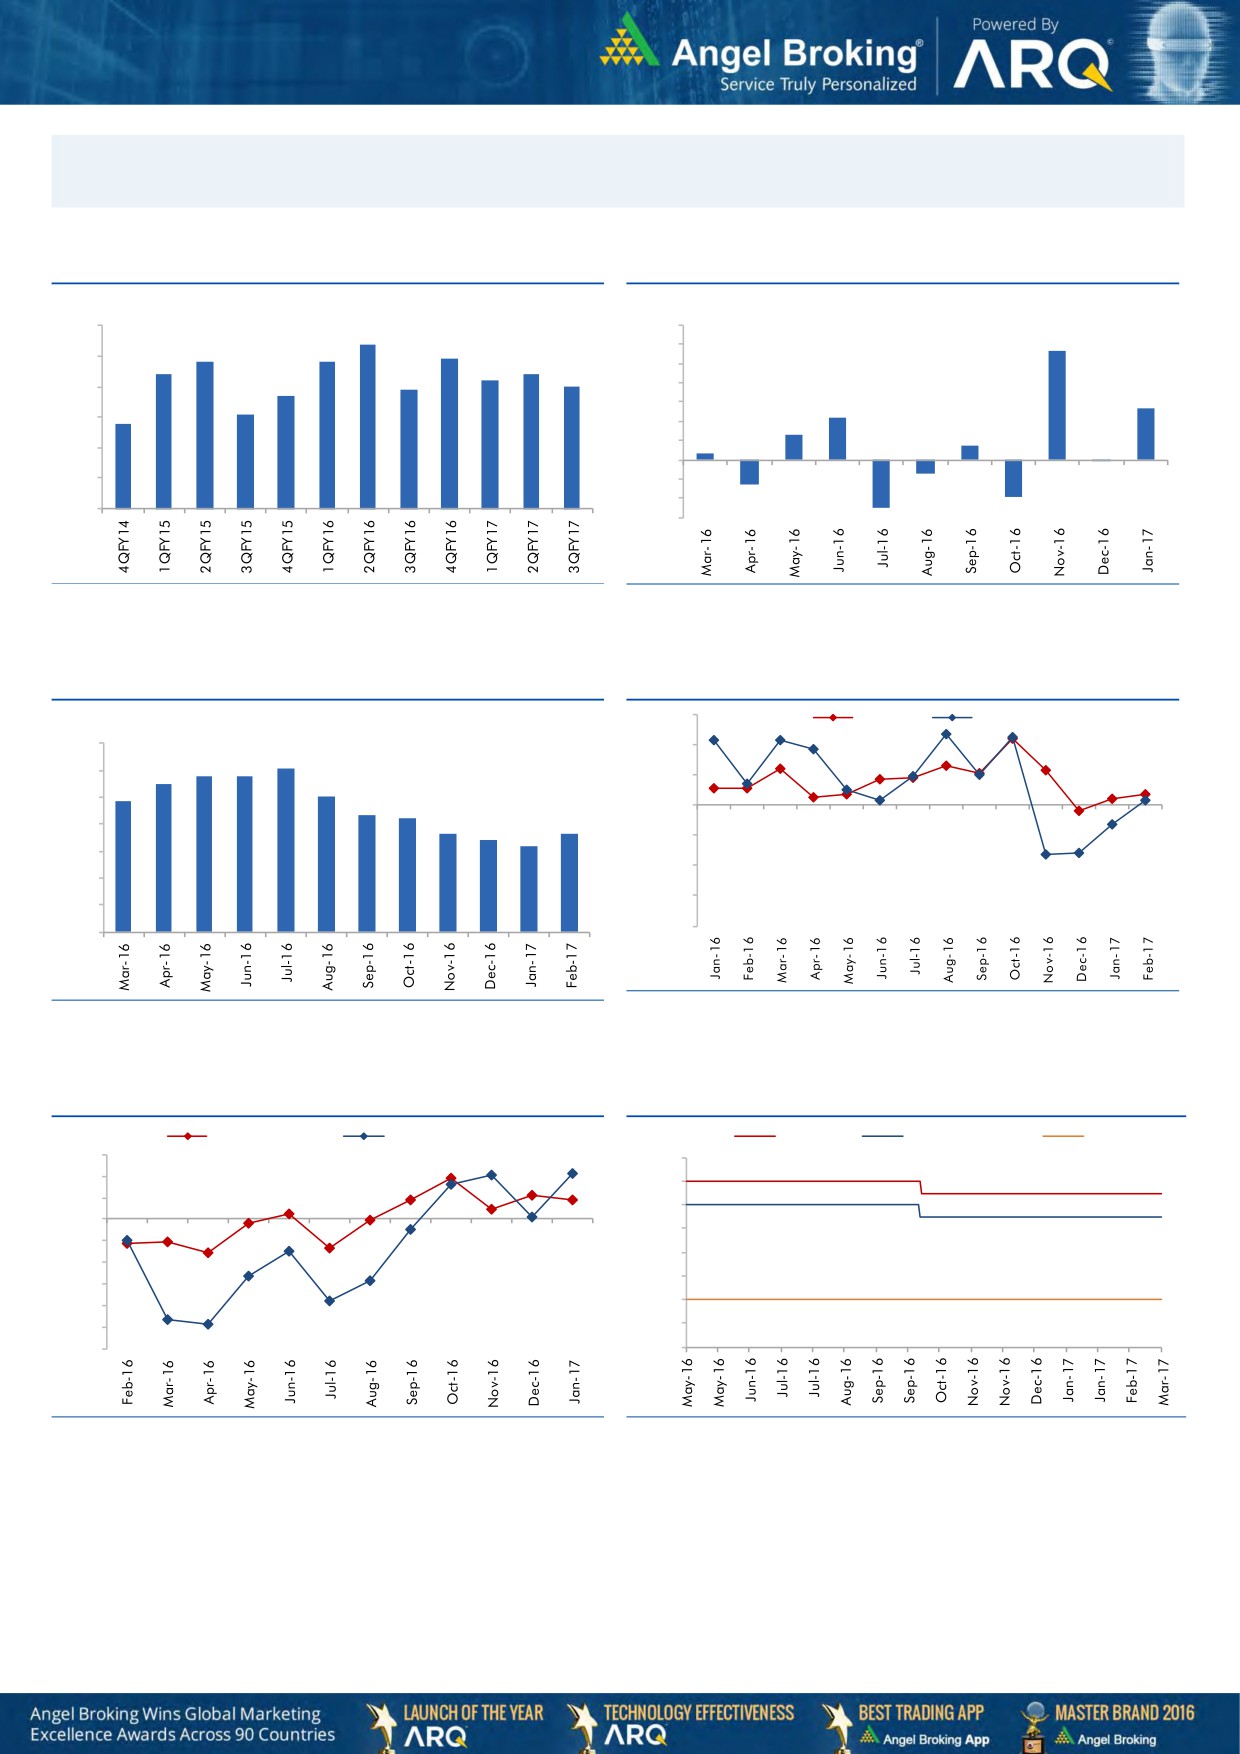
Macro watch
Exhibit 1: Quarterly GDP trends
Exhibit 2: IIP trends
(%)
(%)
9.0
8.4
7.0
5.7
7.8
7.8
7.9
6.0
8.0
7.4
7.4
7.2
5.0
6.9
7.0
6.7
4.0
7.0
2.7
6.1
3.0
2.2
5.8
6.0
2.0
1.3
0.7
1.0
0.3
5.0
-
4.0
(1.0)
(0.1)
(0.7)
(2.0)
3.0
(1.3)
(3.0)
(1.9)
(2.5)
Source: CSO, Angel Research
Source: MOSPI, Angel Research
Exhibit 3: Monthly CPI inflation trends
Exhibit 4: Manufacturing and services PMI
56.0
Mfg. PMI
Services PMI
(%)
7.0
54.0
6.1
5.8
5.8
6.0
5.5
5.1
52.0
4.8
5.0
4.3
4.2
50.0
3.6
3.7
4.0
3.4
3.2
48.0
3.0
46.0
2.0
44.0
1.0
42.0
-
Source: Market, Angel Research; Note: Level above 50 indicates expansion
Source: MOSPI, Angel Research
Exhibit 5: Exports and imports growth trends
Exhibit 6: Key policy rates
(%)
Exports yoy growth
Imports yoy growth
(%)
Repo rate
Reverse Repo rate
CRR
15.0
7.00
10.0
6.50
5.0
6.00
0.0
5.50
(5.0)
5.00
(10.0)
4.50
(15.0)
4.00
(20.0)
(25.0)
3.50
(30.0)
3.00
Source: Bloomberg, Angel Research
Source: RBI, Angel Research
Market Outlook
March 15, 2017
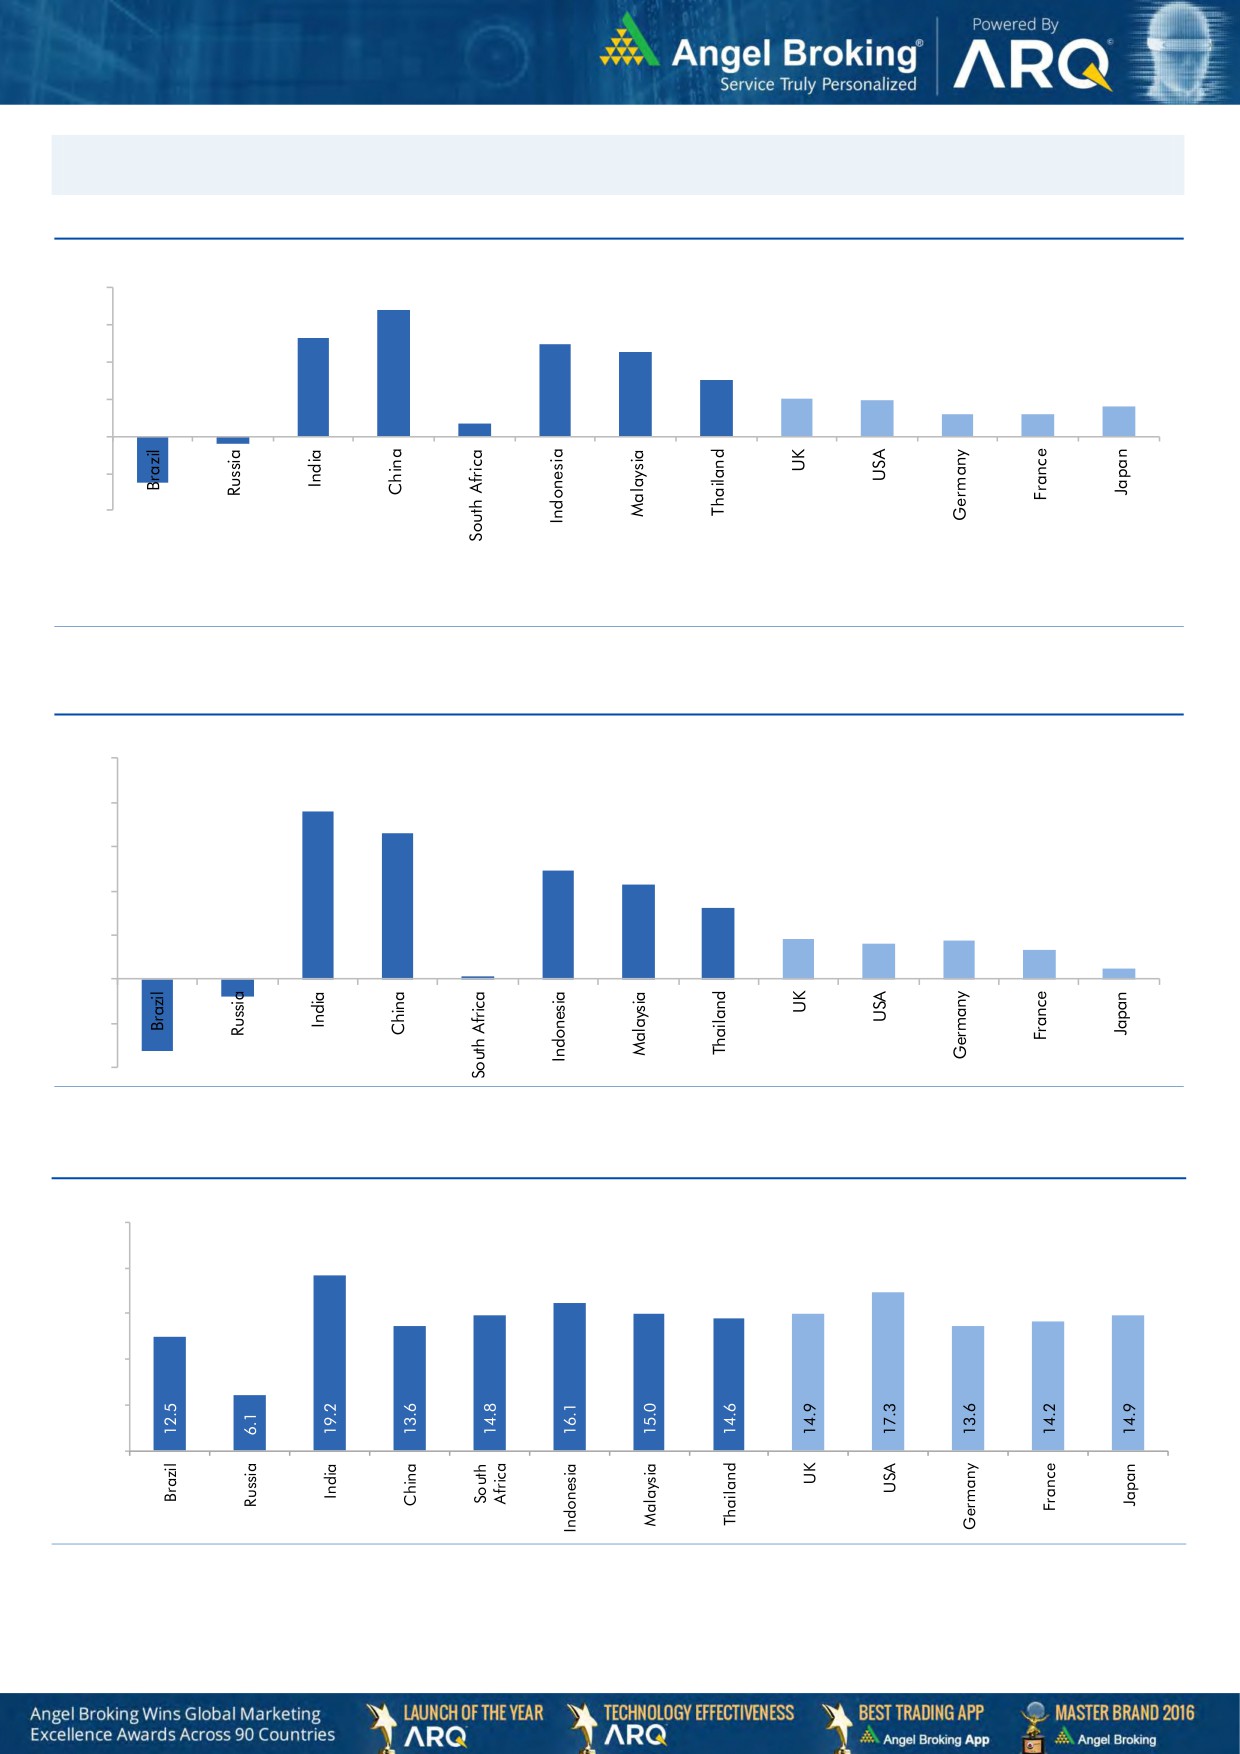
Global watch
Exhibit 1: Latest quarterly GDP Growth (%, yoy) across select developing and developed countries
(%)
8.0
6.8
0.7
5.3
6.0
4.9
4.5
4.0
3.0
2.0
1.9
1.2
1.2
1.6
2.0
-
(2.0)
(2.5)
(0.4)
(4.0)
Source: Bloomberg, Angel Research
Exhibit 2: 2016 GDP Growth projection by IMF (%, yoy) across select developing and developed countries
(%)
10.0
7.6
8.0
6.6
6.0
4.9
4.3
4.0
3.2
1.8
1.7
1.6
1.3
2.0
(0.8)
0.5
(3.3)
0.1
-
(2.0)
(4.0)
Source: IMF, Angel Research
Exhibit 3: One year forward P-E ratio across select developing and developed countries
(x)
25.0
20.0
15.0
10.0
5.0
-
Source: IMF, Angel Research
Market Outlook
March 15, 2017
Exhibit 4: Relative performance of indices across globe
Returns (%)
Country
Name of index
Closing price
1M
3M
1YR
Brazil
Bovespa
64,699
(0.2)
6.6
30.3
Russia
Micex
2,001
(8.6)
(9.4)
7.0
India
Nifty
9,087
3.6
10.0
21.4
China
Shanghai Composite
3,239
0.6
0.4
12.6
South Africa
Top 40
44,653
(2.4)
1.7
(2.0)
Mexico
Mexbol
47,088
(1.5)
0.5
5.2
Indonesia
LQ45
900
0.9
1.3
7.6
Malaysia
KLCI
1,722
1.4
5.7
2.1
Thailand
SET 50
977
(1.3)
2.5
11.1
USA
Dow Jones
20,837
3.3
6.2
20.8
UK
FTSE
7,358
1.4
5.8
19.1
Japan
Nikkei
19,610
1.2
4.5
15.2
Germany
DAX
11,989
2.8
6.2
20.5
France
CAC
4,974
3.0
3.5
12.4
Source: Bloomberg, Angel Research
Stock Watch
March 15, 2017
Company Name
Reco
CMP
Target
Mkt Cap
Sales ( Čcr )
OPM(%)
EPS (Č)
PER(x)
P/BV(x)
RoE(%)
EV/Sales(x)
(Č)
Price ( Č)
( Č cr )
FY17E
FY18E
FY17E
FY18E
FY17E
FY18E
FY17E
FY18E
FY17E
FY18E
FY17E
FY18E
FY17E
FY18E
Agri / Agri Chemical
Rallis
Neutral
239
-
4,650
1,937
2,164
13.3
14.3
9.0
11.0
26.6
21.7
4.6
4.0
18.4
19.8
2.4
2.1
United Phosphorus
Neutral
703
-
35,654
15,176
17,604
18.5
18.5
37.4
44.6
18.8
15.8
3.7
3.1
21.4
21.2
2.5
2.1
Auto & Auto Ancillary
Amara Raja Batteries
Buy
832
1,009
14,214
5,305
6,100
16.0
16.3
28.4
34.0
29.3
24.5
5.7
4.7
19.3
19.3
2.7
2.3
Apollo Tyres
Buy
186
235
9,453
12,877
14,504
14.3
13.9
21.4
23.0
8.7
8.1
1.4
1.2
16.4
15.2
0.9
0.8
Ashok Leyland
Buy
91
111
25,841
20,021
21,915
11.6
11.9
4.5
5.3
20.2
17.1
4.1
3.7
20.6
21.5
1.2
1.1
Bajaj Auto
Neutral
2,867
-
82,969
25,093
27,891
19.5
19.2
143.9
162.5
19.9
17.7
5.6
4.8
30.3
29.4
3.0
2.7
Bharat Forge
Neutral
1,035
-
24,088
7,726
8,713
20.5
21.2
35.3
42.7
29.3
24.2
5.4
4.9
18.9
20.1
3.2
2.8
Ceat
Buy
1,223
1,450
4,948
7,524
8,624
13.0
12.7
131.1
144.3
9.3
8.5
1.7
1.5
19.8
18.6
0.7
0.6
Eicher Motors
Neutral
24,001
-
65,308
16,583
20,447
17.5
18.0
598.0
745.2
40.1
32.2
13.7
10.4
41.2
38.3
3.8
3.0
Exide Industries
Neutral
217
-
18,407
7,439
8,307
15.0
15.0
8.1
9.3
26.7
23.3
3.7
3.3
14.3
16.7
2.1
1.9
Gabriel India
Accumulate
114
130
1,638
1,544
1,715
9.0
9.3
5.4
6.3
21.1
18.1
4.0
3.5
18.9
19.5
1.0
0.9
Hero Motocorp
Neutral
3,358
-
67,048
28,083
30,096
15.3
15.7
171.8
187.0
19.5
18.0
6.8
5.7
30.1
27.9
2.2
2.0
Indag Rubber
Neutral
184
-
482
286
326
19.8
16.8
11.7
13.3
15.7
13.8
2.7
2.5
17.8
17.1
1.4
1.2
Jamna Auto Industries
Neutral
206
-
1,637
1,486
1,620
9.8
9.9
15.0
17.2
13.7
12.0
3.0
2.5
21.8
21.3
1.2
1.1
JK Tyres
Neutral
124
-
2,808
7,455
8,056
15.0
15.0
21.8
24.5
5.7
5.1
1.2
1.0
22.8
21.3
0.5
0.4
L G Balakrishnan & Bros Neutral
575
-
903
1,302
1,432
11.6
11.9
43.7
53.0
13.2
10.9
1.9
1.7
13.8
14.2
0.8
0.7
Mahindra and Mahindra Neutral
1,326
-
82,379
46,534
53,077
11.6
11.7
67.3
78.1
19.7
17.0
3.2
2.8
15.4
15.8
1.7
1.5
Maruti
Accumulate
6,132
6,560
185,226
67,822
83,288
16.0
16.4
253.8
312.4
24.2
19.6
5.6
4.5
23.0
22.9
2.4
1.9
Minda Industries
Neutral
444
-
3,518
2,728
3,042
9.0
9.1
68.2
86.2
6.5
5.2
1.5
1.2
23.8
24.3
1.4
1.2
Motherson Sumi
Neutral
362
-
50,838
45,896
53,687
7.8
8.3
13.0
16.1
27.8
22.5
9.0
7.1
34.7
35.4
1.2
1.0
Rane Brake Lining
Neutral
936
-
741
511
562
11.3
11.5
28.1
30.9
33.3
30.3
5.1
4.6
15.3
15.0
1.6
1.5
Setco Automotive
Neutral
34
-
454
741
837
13.0
13.0
15.2
17.0
2.2
2.0
0.4
0.3
15.8
16.3
1.0
0.9
Subros
Neutral
193
-
1,155
1,488
1,681
11.7
11.9
6.4
7.2
30.1
26.9
3.2
2.9
10.8
11.4
1.0
0.9
Swaraj Engines
Neutral
1,372
-
1,705
660
810
15.2
16.4
54.5
72.8
25.2
18.9
7.9
7.1
31.5
39.2
2.4
1.9
Tata Motors
Neutral
470
-
135,604
300,209
338,549
8.9
8.4
42.7
54.3
11.0
8.7
1.8
1.5
15.6
17.2
0.6
0.5
TVS Motor
Neutral
436
-
20,704
13,390
15,948
6.9
7.1
12.8
16.5
34.2
26.3
8.5
6.7
26.3
27.2
1.6
1.3
Capital Goods
ACE
Neutral
54
-
533
709
814
4.1
4.6
1.4
2.1
38.5
25.6
1.6
1.5
4.4
6.0
0.9
0.8
BEML
Neutral
1,302
-
5,423
3,451
4,055
6.3
9.2
31.4
57.9
41.5
22.5
2.5
2.3
6.3
10.9
1.7
1.4
BGR Energy
Neutral
132
-
952
16,567
33,848
6.0
5.6
7.8
5.9
16.9
22.4
1.0
0.9
4.7
4.2
0.2
0.1
Stock Watch
March 15, 2017
Company Name
Reco
CMP
Target
Mkt Cap
Sales ( Čcr )
OPM(%)
EPS (Č)
PER(x)
P/BV(x)
RoE(%)
EV/Sales(x)
(Č)
Price ( Č)
( Č cr )
FY17E
FY18E
FY17E
FY18E
FY17E
FY18E
FY17E
FY18E
FY17E
FY18E
FY17E
FY18E
FY17E
FY18E
Capital Goods
Bharat Electronics
Neutral
1,572
-
35,110
8,137
9,169
16.8
17.2
58.7
62.5
26.8
25.2
4.2
3.7
44.6
46.3
3.3
3.0
BHEL
Neutral
161
-
39,504
28,797
34,742
-
2.8
2.3
6.9
70.2
23.4
1.2
1.2
1.3
4.8
1.0
0.7
Blue Star
Buy
550
634
5,252
4,283
5,077
5.9
7.3
14.9
22.1
36.9
24.8
7.2
6.0
20.4
26.4
1.3
1.1
CG Power and Industrial
Neutral
71
-
4,444
5,777
6,120
5.9
7.0
3.3
4.5
21.5
15.8
0.9
0.9
4.4
5.9
0.7
0.6
Solutions
Greaves Cotton
Neutral
159
-
3,885
1,755
1,881
16.8
16.9
7.8
8.5
20.4
18.7
4.1
3.8
20.6
20.9
1.9
1.7
Inox Wind
Neutral
179
-
3,961
5,605
6,267
15.7
16.4
24.8
30.0
7.2
6.0
2.0
1.5
25.9
24.4
0.7
0.6
KEC International
Neutral
172
-
4,433
9,294
10,186
7.9
8.1
9.9
11.9
17.4
14.5
2.6
2.2
15.6
16.3
0.7
0.6
KEI Industries
Buy
175
207
1,365
2,682
3,058
10.4
10.0
11.7
12.8
15.0
13.7
3.0
2.5
20.1
18.2
0.7
0.6
Thermax
Neutral
864
-
10,291
5,421
5,940
7.3
7.3
25.7
30.2
33.6
28.6
4.1
3.7
12.2
13.1
1.8
1.6
VATech Wabag
Buy
576
681
3,143
3,136
3,845
8.9
9.1
26.0
35.9
22.2
16.1
2.8
2.4
13.4
15.9
0.9
0.7
Voltas
Accumulate
384
407
12,721
6,511
7,514
7.9
8.7
12.9
16.3
29.8
23.6
5.4
4.7
16.7
18.5
1.7
1.4
Cement
ACC
Neutral
1,415
-
26,563
11,225
13,172
13.2
16.9
44.5
75.5
31.8
18.7
3.0
2.8
11.2
14.2
2.4
2.0
Ambuja Cements
Neutral
234
-
46,365
9,350
10,979
18.2
22.5
5.8
9.5
40.3
24.6
3.4
3.0
10.2
12.5
5.0
4.2
India Cements
Neutral
161
-
4,933
4,364
4,997
18.5
19.2
7.9
11.3
20.3
14.2
1.5
1.4
8.0
8.5
1.9
1.7
J K Lakshmi Cement
Neutral
429
-
5,050
2,913
3,412
14.5
19.5
7.5
22.5
57.2
19.1
3.5
3.0
12.5
18.0
2.3
1.9
JK Cement
Neutral
886
-
6,191
4,398
5,173
15.5
17.5
31.2
55.5
28.4
16.0
3.4
3.0
12.0
15.5
2.0
1.6
Orient Cement
Neutral
134
-
2,746
2,114
2,558
18.5
20.5
8.1
11.3
16.6
11.9
2.4
2.1
9.0
14.0
1.9
1.5
UltraTech Cement
Neutral
3,999
-
109,753
25,768
30,385
21.0
23.5
111.0
160.0
36.0
25.0
4.6
4.0
13.5
15.8
4.4
3.6
Construction
Engineers India
Neutral
149
-
10,017
1,725
1,935
16.0
19.1
11.4
13.9
13.0
10.7
1.8
1.7
13.4
15.3
4.7
4.2
Gujarat Pipavav Port
Neutral
157
-
7,605
705
788
52.2
51.7
5.0
5.6
31.5
28.1
3.1
2.8
11.2
11.2
10.4
8.9
ITNL
Neutral
102
-
3,354
8,946
10,017
31.0
31.6
8.1
9.1
12.6
11.2
0.5
0.5
4.2
5.0
3.7
3.4
KNR Constructions
Neutral
181
-
2,547
1,385
1,673
14.7
14.0
41.2
48.5
4.4
3.7
0.8
0.7
14.9
15.2
1.9
1.6
Larsen & Toubro
Neutral
1,558
-
145,314
111,017
124,908
11.0
11.0
61.1
66.7
25.5
23.3
3.1
2.8
13.1
12.9
2.3
2.2
MEP Infra
Neutral
46
-
753
1,877
1,943
30.6
29.8
3.0
4.2
15.4
11.0
7.5
5.0
0.6
0.6
1.8
1.6
Nagarjuna Const.
Neutral
79
-
4,417
8,842
9,775
9.1
8.8
5.3
6.4
15.0
12.4
1.2
1.1
8.2
9.1
0.7
0.6
NBCC
Neutral
178
-
16,061
7,428
9,549
7.9
8.6
8.2
11.0
21.8
16.2
1.1
0.9
28.2
28.7
1.9
1.4
PNC Infratech
Buy
105
143
2,686
2,350
2,904
13.1
13.2
9.0
8.8
11.6
11.9
0.4
0.4
15.9
13.9
1.3
1.0
Power Mech Projects
Neutral
399
-
587
1,801
2,219
12.7
14.6
72.1
113.9
5.5
3.5
1.0
0.9
16.8
11.9
0.3
0.2
Sadbhav Engineering
Neutral
290
-
4,971
3,598
4,140
10.3
10.6
9.0
11.9
32.2
24.4
3.4
3.0
9.9
11.9
1.7
1.4
Stock Watch
March 15, 2017
Company Name
Reco
CMP
Target
Mkt Cap
Sales ( Čcr )
OPM(%)
EPS (Č)
PER(x)
P/BV(x)
RoE(%)
EV/Sales(x)
(Č)
Price ( Č)
( Č cr )
FY17E
FY18E
FY17E
FY18E
FY17E
FY18E
FY17E
FY18E
FY17E
FY18E
FY17E
FY18E
FY17E
FY18E
Construction
Simplex Infra
Neutral
289
-
1,428
6,829
7,954
10.5
10.5
31.4
37.4
9.2
7.7
1.0
0.9
9.9
13.4
0.6
0.5
SIPL
Neutral
95
-
3,357
1,036
1,252
65.5
66.2
(8.4)
(5.6)
3.6
4.1
(22.8)
(15.9)
11.5
9.5
Financials
Axis Bank
Accumulate
511
580
122,279
46,932
53,575
3.5
3.4
32.4
44.6
15.8
11.5
2.0
1.8
13.6
16.5
-
-
Bank of Baroda
Neutral
161
-
37,109
19,980
23,178
1.8
1.8
11.5
17.3
14.0
9.3
1.6
1.3
8.3
10.1
-
-
Can Fin Homes
Neutral
2,081
-
5,539
420
526
3.5
3.5
86.5
107.8
24.1
19.3
5.2
4.2
23.6
24.1
-
-
Canara Bank
Neutral
286
-
15,508
15,225
16,836
1.8
1.8
14.5
28.0
19.7
10.2
1.4
1.1
5.8
8.5
-
-
Cholamandalam Inv. &
Buy
954
1,230
14,904
2,012
2,317
6.3
6.3
42.7
53.6
22.3
17.8
3.5
3.0
16.9
18.3
-
-
Fin. Co.
Dewan Housing Finance Neutral
343
-
10,748
2,225
2,688
2.9
2.9
29.7
34.6
11.6
9.9
1.9
1.6
16.1
16.8
-
-
Equitas Holdings
Buy
164
235
5,551
939
1,281
11.7
11.5
5.8
8.2
28.3
20.1
2.4
2.2
10.9
11.5
-
-
Federal Bank
Neutral
86
-
14,877
8,259
8,995
3.0
3.0
4.3
5.6
20.1
15.4
1.7
1.6
8.5
10.1
-
-
HDFC
Neutral
1,423
-
225,686
11,475
13,450
3.4
3.4
45.3
52.5
31.4
27.1
6.1
5.4
20.2
20.5
-
-
HDFC Bank
Neutral
1,410
-
360,920
46,097
55,433
4.5
4.5
58.4
68.0
24.1
20.7
4.2
3.5
18.8
18.6
-
-
ICICI Bank
Accumulate
287
315
166,974
42,800
44,686
3.1
3.3
18.0
21.9
15.9
13.1
2.2
2.0
11.1
12.3
-
-
Lakshmi Vilas Bank
Accumulate
162
174
3,110
3,339
3,799
2.7
2.8
11.0
14.0
14.8
11.6
1.5
1.4
11.2
12.7
-
-
LIC Housing Finance
Accumulate
579
630
29,212
3,712
4,293
2.6
2.5
39.0
46.0
14.8
12.6
2.8
2.4
19.9
20.1
-
-
Punjab Natl.Bank
Neutral
144
-
30,568
23,532
23,595
2.3
2.4
6.8
12.6
21.1
11.4
3.3
2.3
3.3
6.5
-
-
RBL Bank
Neutral
477
-
17,631
1,783
2,309
2.6
2.6
12.7
16.4
37.5
29.1
4.1
3.7
12.8
13.3
-
-
Repco Home Finance
Buy
634
825
3,966
388
457
4.5
4.2
30.0
38.0
21.1
16.7
3.5
3.0
18.0
19.2
-
-
South Ind.Bank
Neutral
20
-
2,738
6,435
7,578
2.5
2.5
2.7
3.1
7.5
6.5
1.0
0.8
10.1
11.2
-
-
St Bk of India
Neutral
275
-
219,032
88,650
98,335
2.6
2.6
13.5
18.8
20.4
14.6
1.9
1.7
7.0
8.5
-
-
Union Bank
Neutral
150
-
10,291
13,450
14,925
2.3
2.3
25.5
34.5
5.9
4.3
0.9
0.7
7.5
10.2
-
-
Yes Bank
Neutral
1,532
-
64,896
8,978
11,281
3.3
3.4
74.0
90.0
20.7
17.0
3.9
3.3
17.0
17.2
-
-
FMCG
Akzo Nobel India
Accumulate
1,617
1,720
7,757
2,955
3,309
13.3
13.7
57.2
69.3
28.3
23.3
9.2
7.8
32.7
33.3
2.4
2.1
Asian Paints
Neutral
1,069
-
102,548
17,128
18,978
16.8
16.4
19.1
20.7
56.0
51.7
19.5
18.4
34.8
35.5
5.9
5.3
Britannia
Accumulate
3,178
3,626
38,132
9,594
11,011
14.6
14.9
80.3
94.0
39.6
33.8
16.3
12.6
41.2
-
3.8
3.3
Colgate
Neutral
953
-
25,926
4,605
5,149
23.4
23.4
23.8
26.9
40.1
35.4
22.2
17.3
64.8
66.8
5.6
4.9
Dabur India
Accumulate
273
304
48,151
8,315
9,405
19.8
20.7
8.1
9.2
33.8
29.7
9.4
7.8
31.6
31.0
5.4
4.8
GlaxoSmith Con*
Neutral
5,376
-
22,608
4,350
4,823
21.2
21.4
179.2
196.5
30.0
27.4
8.0
6.8
27.1
26.8
4.6
4.1
Godrej Consumer
Neutral
1,648
-
56,133
10,235
11,428
18.4
18.6
41.1
44.2
40.1
37.3
8.9
7.5
24.9
24.8
5.6
4.9
Stock Watch
March 15, 2017
Company Name
Reco
CMP
Target
Mkt Cap
Sales ( Čcr )
OPM(%)
EPS (Č)
PER(x)
P/BV(x)
RoE(%)
EV/Sales(x)
(Č)
Price ( Č)
( Č cr )
FY17E FY18E
FY17E
FY18E
FY17E
FY18E
FY17E
FY18E
FY17E
FY18E
FY17E
FY18E
FY17E
FY18E
FMCG
HUL
Neutral
914
-
197,774
35,252
38,495
17.8
17.8
20.7
22.4
44.3
40.8
42.3
36.3
95.6
88.9
5.5
5.0
ITC
Accumulate
267
284
324,261
40,059
44,439
38.3
39.2
9.0
10.1
29.8
26.4
8.3
7.3
27.8
27.5
7.6
6.8
Marico
Accumulate
282
300
36,408
6,430
7,349
18.8
19.5
6.4
7.7
44.1
36.6
13.3
11.2
33.2
32.5
5.5
4.7
Nestle*
Neutral
6,114
-
58,951
10,073
11,807
20.7
21.5
124.8
154.2
49.0
39.7
20.1
18.1
34.8
36.7
5.7
4.8
Procter & Gamble
Accumulate
6,825
7,369
22,154
2,939
3,342
23.2
23.0
146.2
163.7
46.7
41.7
11.8
9.8
25.3
23.5
7.1
6.2
Hygiene
Tata Global
Neutral
140
-
8,804
8,675
9,088
9.8
9.8
7.4
8.2
18.9
17.0
1.5
1.4
7.9
8.1
0.9
0.9
IT
HCL Tech^
Buy
853
1,000
120,356
49,242
57,168
20.5
20.5
55.7
64.1
15.3
13.3
3.1
2.4
20.3
17.9
2.3
1.9
Infosys
Buy
1,035
1,249
237,734
68,350
77,326
27.0
27.0
62.5
69.4
16.6
14.9
3.5
3.2
21.3
21.6
2.9
2.5
TCS
Accumulate
2,562
2,700
504,893
119,025
133,308
27.6
27.6
131.2
145.5
19.5
17.6
6.3
5.8
32.4
33.1
4.0
3.5
Tech Mahindra
Buy
480
600
46,706
29,673
32,937
15.5
17.0
32.8
39.9
14.6
12.0
2.9
2.5
19.6
20.7
1.3
1.1
Wipro
Buy
500
583
121,654
55,440
60,430
18.1
18.1
36.1
38.9
13.9
12.9
2.5
2.3
19.0
17.6
1.9
1.7
Media
D B Corp
Neutral
383
-
7,034
2,297
2,590
27.4
28.2
21.0
23.4
18.2
16.4
4.3
3.7
23.7
23.1
2.9
2.5
Hindustan Media
Neutral
280
-
2,055
1,016
1,138
24.3
25.2
27.3
30.1
10.3
9.3
2.0
1.7
16.2
15.8
1.3
1.2
Ventures
HT Media
Neutral
82
-
1,919
2,693
2,991
12.6
12.9
7.9
9.0
10.4
9.2
0.9
0.8
7.8
8.3
0.3
0.2
Jagran Prakashan
Buy
186
225
6,072
2,355
2,635
28.0
28.0
10.8
12.5
17.2
14.9
3.7
3.2
21.7
21.7
2.6
2.3
Sun TV Network
Neutral
741
-
29,184
2,850
3,265
70.1
71.0
26.2
30.4
28.3
24.4
7.2
6.4
24.3
25.6
9.8
8.5
TV Today Network
Buy
258
344
1,541
567
645
26.7
27.0
15.4
18.1
16.8
14.3
2.5
2.2
14.9
15.2
2.3
1.9
Metals & Mining
Coal India
Neutral
296
-
183,460
84,638
94,297
21.4
22.3
24.5
27.1
12.1
10.9
5.0
4.8
42.6
46.0
1.7
1.5
Hind. Zinc
Neutral
291
-
122,957
14,252
18,465
55.9
48.3
15.8
21.5
18.4
13.5
3.0
2.6
17.0
20.7
8.6
6.7
Hindalco
Neutral
190
-
39,334
107,899
112,095
7.4
8.2
9.2
13.0
20.7
14.6
1.0
0.9
4.8
6.6
0.9
0.8
JSW Steel
Neutral
181
-
43,836
53,201
58,779
16.1
16.2
130.6
153.7
1.4
1.2
0.2
0.2
14.0
14.4
1.6
1.4
NMDC
Neutral
139
-
44,010
6,643
7,284
44.4
47.7
7.1
7.7
19.6
18.1
1.7
1.7
8.8
9.2
4.4
4.0
SAIL
Neutral
60
-
24,843
47,528
53,738
(0.7)
2.1
(1.9)
2.6
23.1
0.7
0.6
(1.6)
3.9
1.4
1.2
Tata Steel
Neutral
473
-
45,909
121,374
121,856
7.2
8.4
18.6
34.3
25.4
13.8
1.6
1.5
6.1
10.1
1.0
1.0
Vedanta
Neutral
254
-
75,214
71,744
81,944
19.2
21.7
13.4
20.1
18.9
12.6
1.6
1.5
8.4
11.3
1.4
1.1
Oil & Gas
Cairn India
Neutral
283
-
53,135
9,127
10,632
4.3
20.6
8.8
11.7
32.2
24.2
1.0
1.0
3.3
4.2
7.3
6.1
GAIL
Neutral
376
-
47,720
56,220
65,198
9.3
10.1
27.1
33.3
13.9
11.3
1.3
1.2
9.3
10.7
1.0
0.9
Indian Oil Corp
Neutral
374
-
181,611
373,359
428,656
5.9
5.5
54.0
59.3
6.9
6.3
1.1
1.0
16.0
15.6
0.6
0.5
ONGC
Neutral
192
-
246,206
137,222
152,563
15.0
21.8
19.5
24.1
9.8
8.0
0.8
0.8
8.5
10.1
2.1
1.9
Stock Watch
March 15, 2017
Company Name
Reco
CMP
Target
Mkt Cap
Sales ( Čcr )
OPM(%)
EPS (Č)
PER(x)
P/BV(x)
RoE(%)
EV/Sales(x)
(Č)
Price ( Č)
( Č cr )
FY17E FY18E
FY17E
FY18E
FY17E
FY18E
FY17E
FY18E
FY17E
FY18E
FY17E
FY18E
FY17E
FY18E
Oil & Gas
Reliance Industries
Neutral
1,289
-
418,279
301,963
358,039
12.1
12.6
87.7
101.7
14.7
12.7
1.5
1.4
10.7
11.3
1.9
1.6
Pharmaceuticals
Alembic Pharma
Accumulate
614
689
11,570
3,483
4,244
20.2
21.4
24.3
33.6
25.3
18.3
5.8
4.6
25.5
25.3
3.3
2.6
Alkem Laboratories Ltd
Buy
1,931
2,257
23,082
6,065
7,009
18.7
20.0
80.2
92.0
24.1
21.0
5.4
4.5
22.5
21.6
3.8
3.2
Aurobindo Pharma
Buy
663
877
38,770
15,720
18,078
23.7
23.7
41.4
47.3
16.0
14.0
4.2
3.3
29.6
26.1
2.7
2.3
Aventis*
Neutral
4,272
-
9,838
2,277
2,597
16.6
17.4
128.9
157.0
33.1
27.2
5.7
4.4
21.6
26.4
4.1
3.4
Cadila Healthcare
Neutral
439
-
44,932
10,429
12,318
17.7
21.6
13.1
19.2
33.5
22.9
7.0
5.6
22.8
27.1
4.3
3.6
Cipla
Sell
599
465
48,152
15,378
18,089
15.7
16.8
19.3
24.5
31.0
24.4
3.6
3.2
12.3
13.9
3.3
2.8
Dishman Pharma
Sell
239
143
3,864
1,718
1,890
22.7
22.8
9.5
11.3
25.2
21.2
2.4
2.2
10.1
10.9
2.7
2.4
Dr Reddy's
Neutral
2,734
-
45,297
16,043
18,119
18.0
23.0
78.6
130.9
34.8
20.9
3.4
3.0
10.1
15.2
2.6
2.5
GSK Pharma*
Neutral
2,695
-
22,829
2,800
3,290
10.2
20.6
32.2
60.3
83.7
44.7
15.5
15.3
17.2
34.5
7.9
6.8
Indoco Remedies
Reduce
259
240
2,390
1,112
1,289
16.2
18.2
11.6
16.0
22.4
16.2
3.6
3.0
17.0
20.1
2.3
1.9
Ipca labs
Accumulate
563
613
7,098
3,258
3,747
12.8
15.3
12.1
19.2
46.5
29.3
2.9
2.7
6.4
9.5
2.3
2.0
Lupin
Buy
1,451
1,809
65,522
15,912
18,644
26.4
26.7
58.1
69.3
25.0
20.9
4.9
4.0
21.4
20.9
4.2
3.4
Sun Pharma
Buy
708
847
169,926
31,129
35,258
32.0
32.9
30.2
35.3
23.5
20.1
3.8
3.2
20.0
20.1
5.0
4.3
Power
NTPC
Neutral
160
-
131,515
86,605
95,545
17.5
20.8
11.8
13.4
13.5
11.9
1.4
1.3
10.5
11.1
2.9
2.9
Power Grid
Buy
194
223
101,310
25,315
29,193
88.2
88.7
14.2
17.2
13.7
11.3
2.1
1.8
15.2
16.1
8.7
7.8
Tata Power
Neutral
84
-
22,625
36,916
39,557
17.4
27.1
5.1
6.3
16.4
13.3
1.4
1.3
9.0
10.3
1.6
1.5
Real Estate
MLIFE
Buy
378
522
1,551
1,152
1,300
22.7
24.6
29.9
35.8
12.6
10.6
0.9
0.9
7.6
8.6
2.1
1.7
Prestige Estate
Buy
168
210
6,302
4,707
5,105
25.2
26.0
10.3
13.0
16.3
12.9
1.3
1.2
10.3
10.2
2.5
2.2
Telecom
Bharti Airtel
Neutral
361
-
144,446
105,086
114,808
34.5
34.7
12.2
16.4
29.6
22.0
2.0
1.9
6.8
8.4
2.3
2.0
Idea Cellular
Neutral
103
-
37,134
40,133
43,731
37.2
37.1
6.4
6.5
16.1
15.9
1.3
1.2
8.2
7.6
1.9
1.7
zOthers
Abbott India
Neutral
4,470
-
9,498
3,153
3,583
14.1
14.4
152.2
182.7
29.4
24.5
144.2
123.1
25.6
26.1
2.7
2.3
Asian Granito
Buy
301
351
907
1,060
1,169
12.2
12.5
12.7
15.9
23.8
19.0
2.3
2.0
9.5
10.7
1.2
1.0
Bajaj Electricals
Neutral
315
-
3,192
4,801
5,351
5.7
6.2
10.4
13.7
30.3
23.0
3.7
3.3
12.4
14.5
0.7
0.6
Banco Products (India)
Neutral
199
-
1,424
1,353
1,471
12.3
12.4
14.5
16.3
13.7
12.2
19.0
17.1
14.5
14.6
1.0
106.4
Coffee Day Enterprises
Neutral
234
-
4,812
2,964
3,260
20.5
21.2
4.7
8.0
-
29.2
2.7
2.5
5.5
8.5
2.0
1.8
Ltd
Competent Automobiles Neutral
170
-
104
1,137
1,256
3.1
2.7
28.0
23.6
6.1
7.2
32.7
29.5
14.3
11.5
0.1
0.1
Elecon Engineering
Neutral
53
-
590
1,482
1,660
13.7
14.5
3.9
5.8
13.5
9.1
3.2
2.9
7.8
10.9
0.7
0.6
Finolex Cables
Neutral
459
-
7,025
2,883
3,115
12.0
12.1
14.2
18.6
32.4
24.7
17.2
15.0
15.8
14.6
2.1
1.9
Stock Watch
March 15, 2017
Company Name
Reco
CMP
Target
Mkt Cap
Sales ( Čcr )
OPM(%)
EPS (Č)
PER(x)
P/BV(x)
RoE(%)
EV/Sales(x)
(Č)
Price ( Č)
( Č cr )
FY17E
FY18E
FY17E
FY18E
FY17E
FY18E
FY17E
FY18E
FY17E
FY18E
FY17E
FY18E
FY17E
FY18E
zOthers
Garware Wall Ropes
Neutral
688
-
1,505
863
928
15.1
15.2
36.4
39.4
18.9
17.5
3.4
2.9
17.5
15.9
1.7
1.5
Goodyear India*
Neutral
718
-
1,657
1,598
1,704
10.4
10.2
49.4
52.6
14.5
13.7
67.1
58.9
18.2
17.0
0.7
100.3
Hitachi
Neutral
1,495
-
4,065
2,081
2,433
8.8
8.9
33.4
39.9
44.8
37.5
36.1
30.1
22.1
21.4
1.9
1.6
HSIL
Neutral
327
-
2,364
2,384
2,515
15.8
16.3
15.3
19.4
21.4
16.9
21.2
18.3
7.8
9.3
1.2
1.1
Interglobe Aviation
Neutral
876
-
31,670
21,122
26,005
14.5
27.6
110.7
132.1
7.9
6.6
47.4
33.8
168.5
201.1
1.5
1.2
Jyothy Laboratories
Neutral
371
-
6,738
1,440
2,052
11.5
13.0
8.5
10.0
43.6
37.1
10.6
9.8
18.6
19.3
5.0
3.5
Kirloskar Engines India
Neutral
379
-
5,475
2,554
2,800
9.9
10.0
10.5
12.1
36.1
31.3
15.1
14.2
10.7
11.7
1.8
1.6
Ltd
Linc Pen & Plastics
Neutral
256
-
379
382
420
9.3
9.5
13.5
15.7
19.0
16.3
3.3
2.8
17.1
17.3
1.1
0.9
M M Forgings
Neutral
497
-
599
546
608
20.4
20.7
41.3
48.7
12.0
10.2
68.0
60.2
16.6
17.0
0.9
0.8
Manpasand Bever.
Neutral
720
-
4,120
836
1,087
19.6
19.4
16.9
23.8
42.6
30.2
5.1
4.5
12.0
14.8
4.7
3.5
Mirza International
Buy
91
107
1,089
963
1,069
17.2
18.0
6.1
7.5
14.8
12.1
2.3
1.9
15.0
15.7
1.3
1.2
MT Educare
Neutral
84
-
336
366
417
17.7
18.2
9.4
10.8
9.0
7.8
2.0
1.7
22.2
22.3
0.8
0.7
Narayana Hrudaya
Neutral
314
-
6,422
1,873
2,166
11.5
11.7
2.6
4.0
118.8
79.3
7.3
6.6
6.1
8.3
3.5
3.0
Navkar Corporation
Buy
171
265
2,433
369
561
42.9
42.3
6.9
11.5
24.7
14.8
1.7
1.6
7.4
10.5
7.6
5.0
Navneet Education
Neutral
145
-
3,375
1,062
1,147
24.0
24.0
6.1
6.6
23.7
21.8
4.9
4.3
20.6
19.8
3.3
3.0
Nilkamal
Neutral
1,930
-
2,879
1,995
2,165
10.7
10.4
69.8
80.6
27.6
23.9
110.3
95.8
16.6
16.5
1.4
1.3
Page Industries
Neutral
14,285
-
15,934
2,450
3,124
20.1
17.6
299.0
310.0
47.8
46.1
318.2
242.9
47.1
87.5
6.6
5.2
Parag Milk Foods
Neutral
215
-
1,806
1,919
2,231
9.3
9.6
9.5
12.9
22.7
16.6
3.5
2.9
15.5
17.5
1.1
0.9
Quick Heal
Neutral
243
-
1,701
408
495
27.3
27.0
7.7
8.8
31.4
27.6
2.9
2.9
9.3
10.6
3.3
2.7
Radico Khaitan
Buy
125
147
1,662
1,667
1,824
13.0
13.2
6.7
8.2
18.8
15.3
1.7
1.6
9.0
10.2
1.4
1.2
Relaxo Footwears
Neutral
462
-
5,548
2,085
2,469
9.2
8.2
7.6
8.0
61.1
58.1
23.7
20.2
17.9
18.8
2.8
2.3
S H Kelkar & Co.
Neutral
298
-
4,310
1,036
1,160
15.1
15.0
6.1
7.2
48.8
41.5
5.2
4.8
10.7
11.5
4.0
3.6
Siyaram Silk Mills
Accumulate
1,671
1,872
1,567
1,652
1,857
11.6
11.7
92.4
110.1
18.1
15.2
2.7
2.3
14.7
15.2
1.2
1.0
Styrolution ABS India*
Neutral
600
-
1,056
1,440
1,537
9.2
9.0
40.6
42.6
14.8
14.1
37.8
34.3
12.3
11.6
0.7
0.6
Surya Roshni
Neutral
185
-
812
3,342
3,625
7.8
7.5
17.3
19.8
10.7
9.4
20.4
16.3
10.5
10.8
0.5
0.5
Team Lease Serv.
Neutral
881
-
1,507
3,229
4,001
1.5
1.8
22.8
32.8
38.7
26.8
4.2
3.6
10.7
13.4
0.4
0.3
The Byke Hospitality
Neutral
172
-
689
287
384
20.5
20.5
7.6
10.7
22.6
16.1
4.7
3.8
20.7
23.5
2.4
1.8
Transport Corporation of
Neutral
209
-
1,602
2,671
2,911
8.5
8.8
13.9
15.7
15.1
13.4
2.1
1.8
13.7
13.8
0.7
0.7
India
TVS Srichakra
Neutral
3,067
-
2,348
2,304
2,614
13.7
13.8
231.1
266.6
13.3
11.5
344.6
271.3
33.9
29.3
1.0
0.9
Stock Watch
March 15, 2017
Company Name
Reco
CMP
Target Mkt Cap
Sales ( Čcr )
OPM(%)
EPS (Č)
PER(x)
P/BV(x)
RoE(%)
EV/Sales(x)
(Č)
Price ( Č)
( Č cr )
FY17E FY18E FY17E FY18E FY17E FY18E FY17E FY18E FY17E FY18E FY17E FY18E FY17E FY18E
zOthers
UFO Moviez
Neutral
400
-
1,104
619
685
33.2
33.4
30.0
34.9
13.4
11.5
1.9
1.6
13.8
13.9
1.5
1.2
Visaka Industries
Neutral
243
-
385
1,051
1,138
10.3
10.4
21.0
23.1
11.6
10.5
31.1
29.1
9.0
9.2
0.6
0.6
VRL Logistics
Neutral
303
-
2,765
1,902
2,119
16.7
16.6
14.6
16.8
20.8
18.0
4.6
4.0
21.9
22.2
1.6
1.4
Wonderla Holidays
Neutral
385
-
2,175
287
355
38.0
40.0
11.3
14.2
34.1
27.1
4.9
4.3
21.4
23.9
7.3
5.9
VIP Industries
Neutral
181
-
2,551
1,270
1,450
10.4
10.4
5.6
6.5
32.2
27.8
6.7
5.8
20.7
21.1
2.0
1.8
Source: Company, Angel Research; Note: *December year end; #September year end; &October year end; Price as on March 14, 2017
Market Outlook
March 15, 2017
Research Team Tel: 022 - 39357800
DISCLAIMER
Angel Broking Private Limited (hereinafter referred to as “Angel”) is a registered Member of National Stock Exchange of India
Limited,Bombay Stock Exchange Limited and Metropolitan Stock Exchange Limited. It is also registered as a Depository Participant with
CDSL and Portfolio Manager with SEBI. It also has registration with AMFI as a Mutual Fund Distributor. Angel Broking Private Limited is a
registered entity with SEBI for Research Analyst in terms of SEBI (Research Analyst) Regulations, 2014 vide registration number
INH000000164. Angel or its associates has not been debarred/ suspended by SEBI or any other regulatory authority for accessing
/dealing in securities Market. Angel or its associates/analyst has not received any compensation / managed or
co-managed public offering of securities of the company covered by Analyst during the past twelve months.
This document is solely for the personal information of the recipient, and must not be singularly used as the basis of any investment
decision. Nothing in this document should be construed as investment or financial advice. Each recipient of this document should make
such investigations as they deem necessary to arrive at an independent evaluation of an investment in the securities of the companies
referred to in this document (including the merits and risks involved), and should consult their own advisors to determine the merits and
risks of such an investment.
Reports based on technical and derivative analysis center on studying charts of a stock's price movement, outstanding positions and
trading volume, as opposed to focusing on a company's fundamentals and, as such, may not match with a report on a company's
fundamentals. Investors are advised to refer the Fundamental and Technical Research Reports available on our website to evaluate the
contrary view, if any.
The information in this document has been printed on the basis of publicly available information, internal data and other reliable
sources believed to be true, but we do not represent that it is accurate or complete and it should not be relied on as such, as this
document is for general guidance only. Angel Broking Pvt. Limited or any of its affiliates/ group companies shall not be in any way
responsible for any loss or damage that may arise to any person from any inadvertent error in the information contained in this report.
Angel Broking Pvt. Limited has not independently verified all the information contained within this document. Accordingly, we cannot
testify, nor make any representation or warranty, express or implied, to the accuracy, contents or data contained within this document.
While Angel Broking Pvt. Limited endeavors to update on a reasonable basis the information discussed in this material, there may be
regulatory, compliance, or other reasons that prevent us from doing so.
This document is being supplied to you solely for your information, and its contents, information or data may not be reproduced,
redistributed or passed on, directly or indirectly.
Neither Angel Broking Pvt. Limited, nor its directors, employees or affiliates shall be liable for any loss or damage that may arise from
or in connection with the use of this information.